CytoTRACE Analysis
Preface
TIP
CytoTRACE (Cellular Trajectory Reconstruction Analysis using gene Counts and Expression) is a powerful, prior-knowledge-free pseudotime analysis tool. By evaluating the transcriptional diversity of individual cells, it can robustly predict cell differentiation states, with particular expertise in identifying the starting points of developmental trajectories (i.e., cells with the highest differentiation potential).
In complex biological systems, determining which cell population represents the most primitive "root" state is a core challenge in pseudotime analysis. CytoTRACE is based on a central hypothesis: Cells with higher differentiation potential (such as stem cells, progenitor cells) exhibit more complex transcriptional activity, i.e., a greater number of detectable expressed genes. This characteristic makes it an ideal partner for trajectory construction tools like Monocle, providing objective, unbiased evidence for trajectory starting point selection.
Core Functions of CytoTRACE
- Unbiased starting point identification: Automatically predicts cell differentiation potential without specifying any starting or ending points.
- Robustness and universality: Widely validated across various tissues, species, and sequencing platforms.
- Easy interpretation: Provides a continuous score ranging from 0 (differentiation endpoint) to 1 (differentiation starting point), intuitively reflecting cell differentiation levels.
This document aims to provide researchers with a detailed CytoTRACE technical guide, covering its core principles, operation methods on the SeekSoul™ Online cloud platform, result interpretation, practical cases, and common questions, helping you effectively integrate it into your single-cell analysis workflow.
CytoTRACE Theoretical Foundation
Core Principles
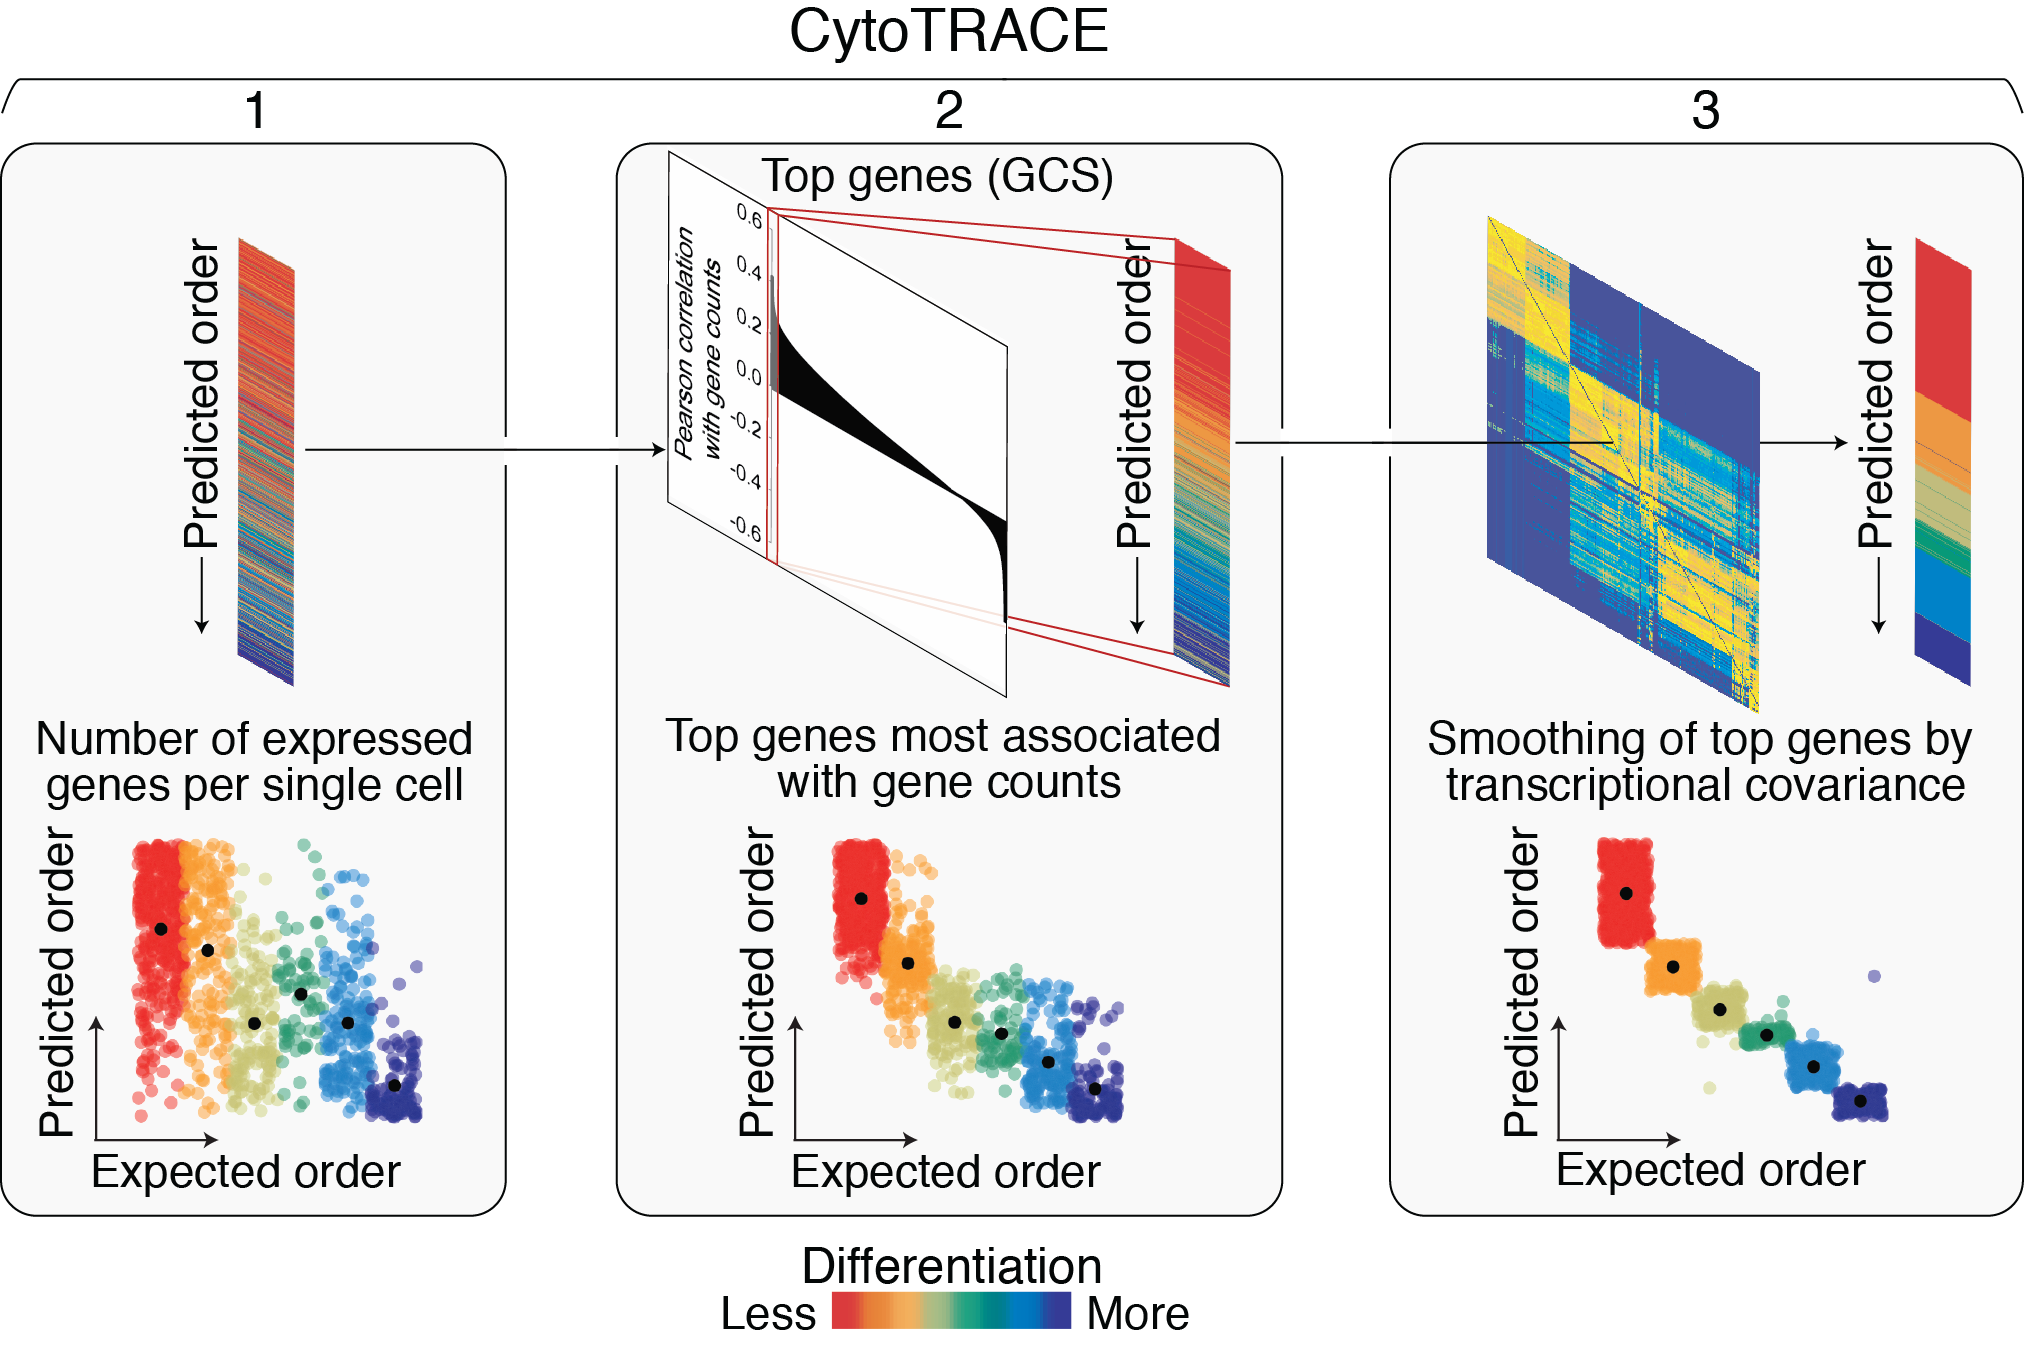
The CytoTRACE calculation process mainly consists of three steps:
Gene Counts: Calculate the total number of genes with expression levels greater than zero in each single cell. This is a direct indicator of cellular transcriptional complexity.
Gene Counts Signature (GCS): Identify genes whose expression patterns are positively correlated with gene counts. First, normalize the expression matrix, then calculate the correlation between each gene and gene counts, and finally select the top 200 genes with the strongest correlations to calculate their geometric mean expression values, obtaining the GCS.
CytoTRACE Score Calculation: Utilize local similarity between cells, optimize GCS through two-step smoothing processing (Markov model and non-negative least squares regression), and finally obtain the CytoTRACE score for each cell. The scores are sorted and scaled, ranging from 0 to 1, where 1 represents the lowest differentiation degree (highest stemness) and 0 represents the highest differentiation degree.
SeekSoul™ Online Operation Guide
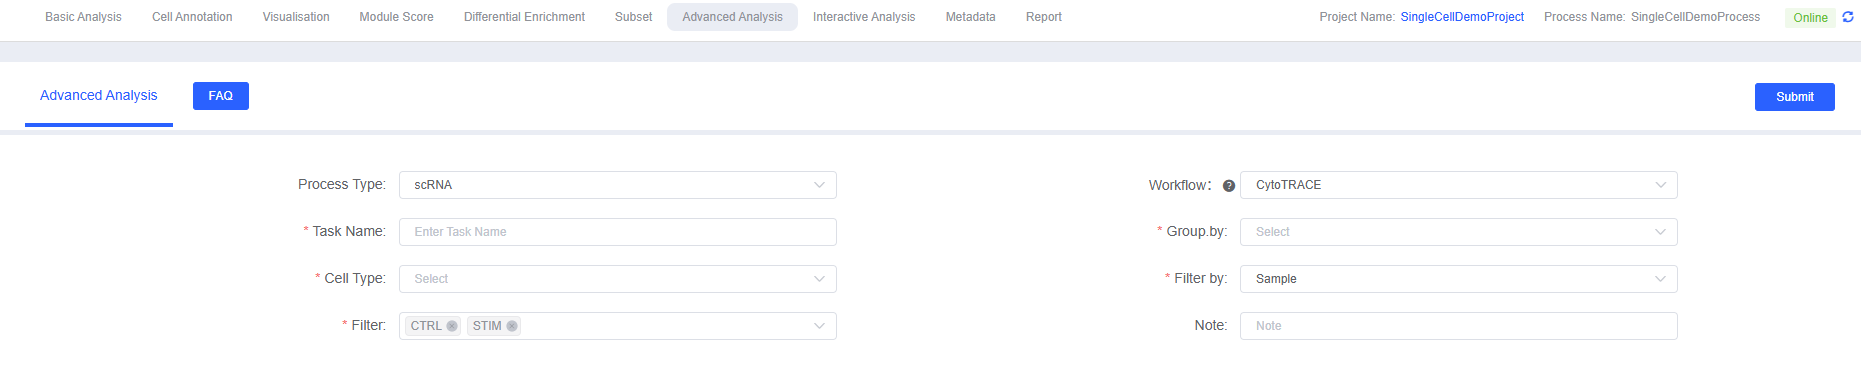
When performing CytoTRACE analysis on the SeekSoul™ Online cloud platform, you need to set the following parameters:
Parameter Details
| Interface Parameter | Description |
|---|---|
| Task Name | The name of this analysis task, used to distinguish between different analysis tasks. |
| Group.by | Select the metadata column used to define cell populations, usually cell type annotations or clustering results. |
| Cell Type | Select specific cell subsets to include in the analysis. |
| Filter by | Select the metadata column used to filter samples or groups, such as sample sources. |
| Filter | Select samples or groups to retain for analysis. |
| Note | Custom remark information for this analysis. |
Result Interpretation
After analysis is complete, the platform generates a detailed report containing the following core parts:
CytoTRACE Score Mapping Plot
This is the most intuitive result, mapping CytoTRACE scores to dimensionality reduction plots such as UMAP/t-SNE.
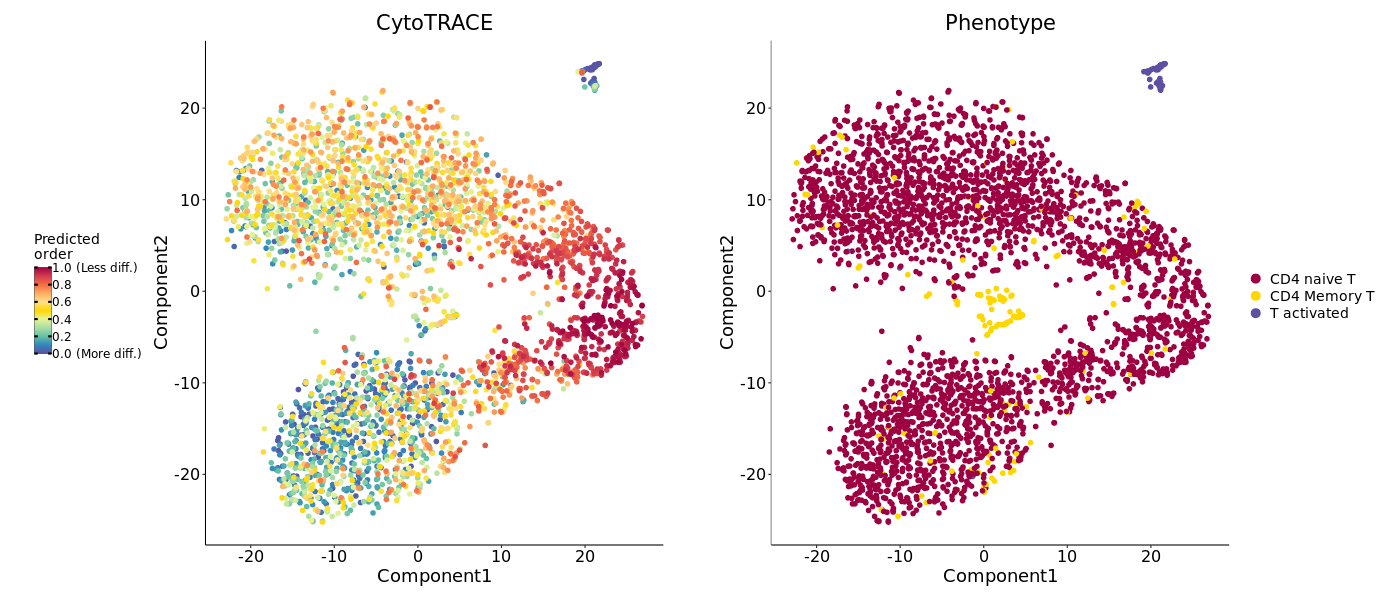
- Graph Interpretation: Each point is a cell, and color represents the CytoTRACE score. Typically, yellow represents high scores (high differentiation potential, close to the starting point), and purple represents low scores (high differentiation degree, close to the endpoint).
- Analysis Points: Observe which cell population has the brightest color (highest score), as this cell population is the biological starting point of the trajectory.
Score Box Plot
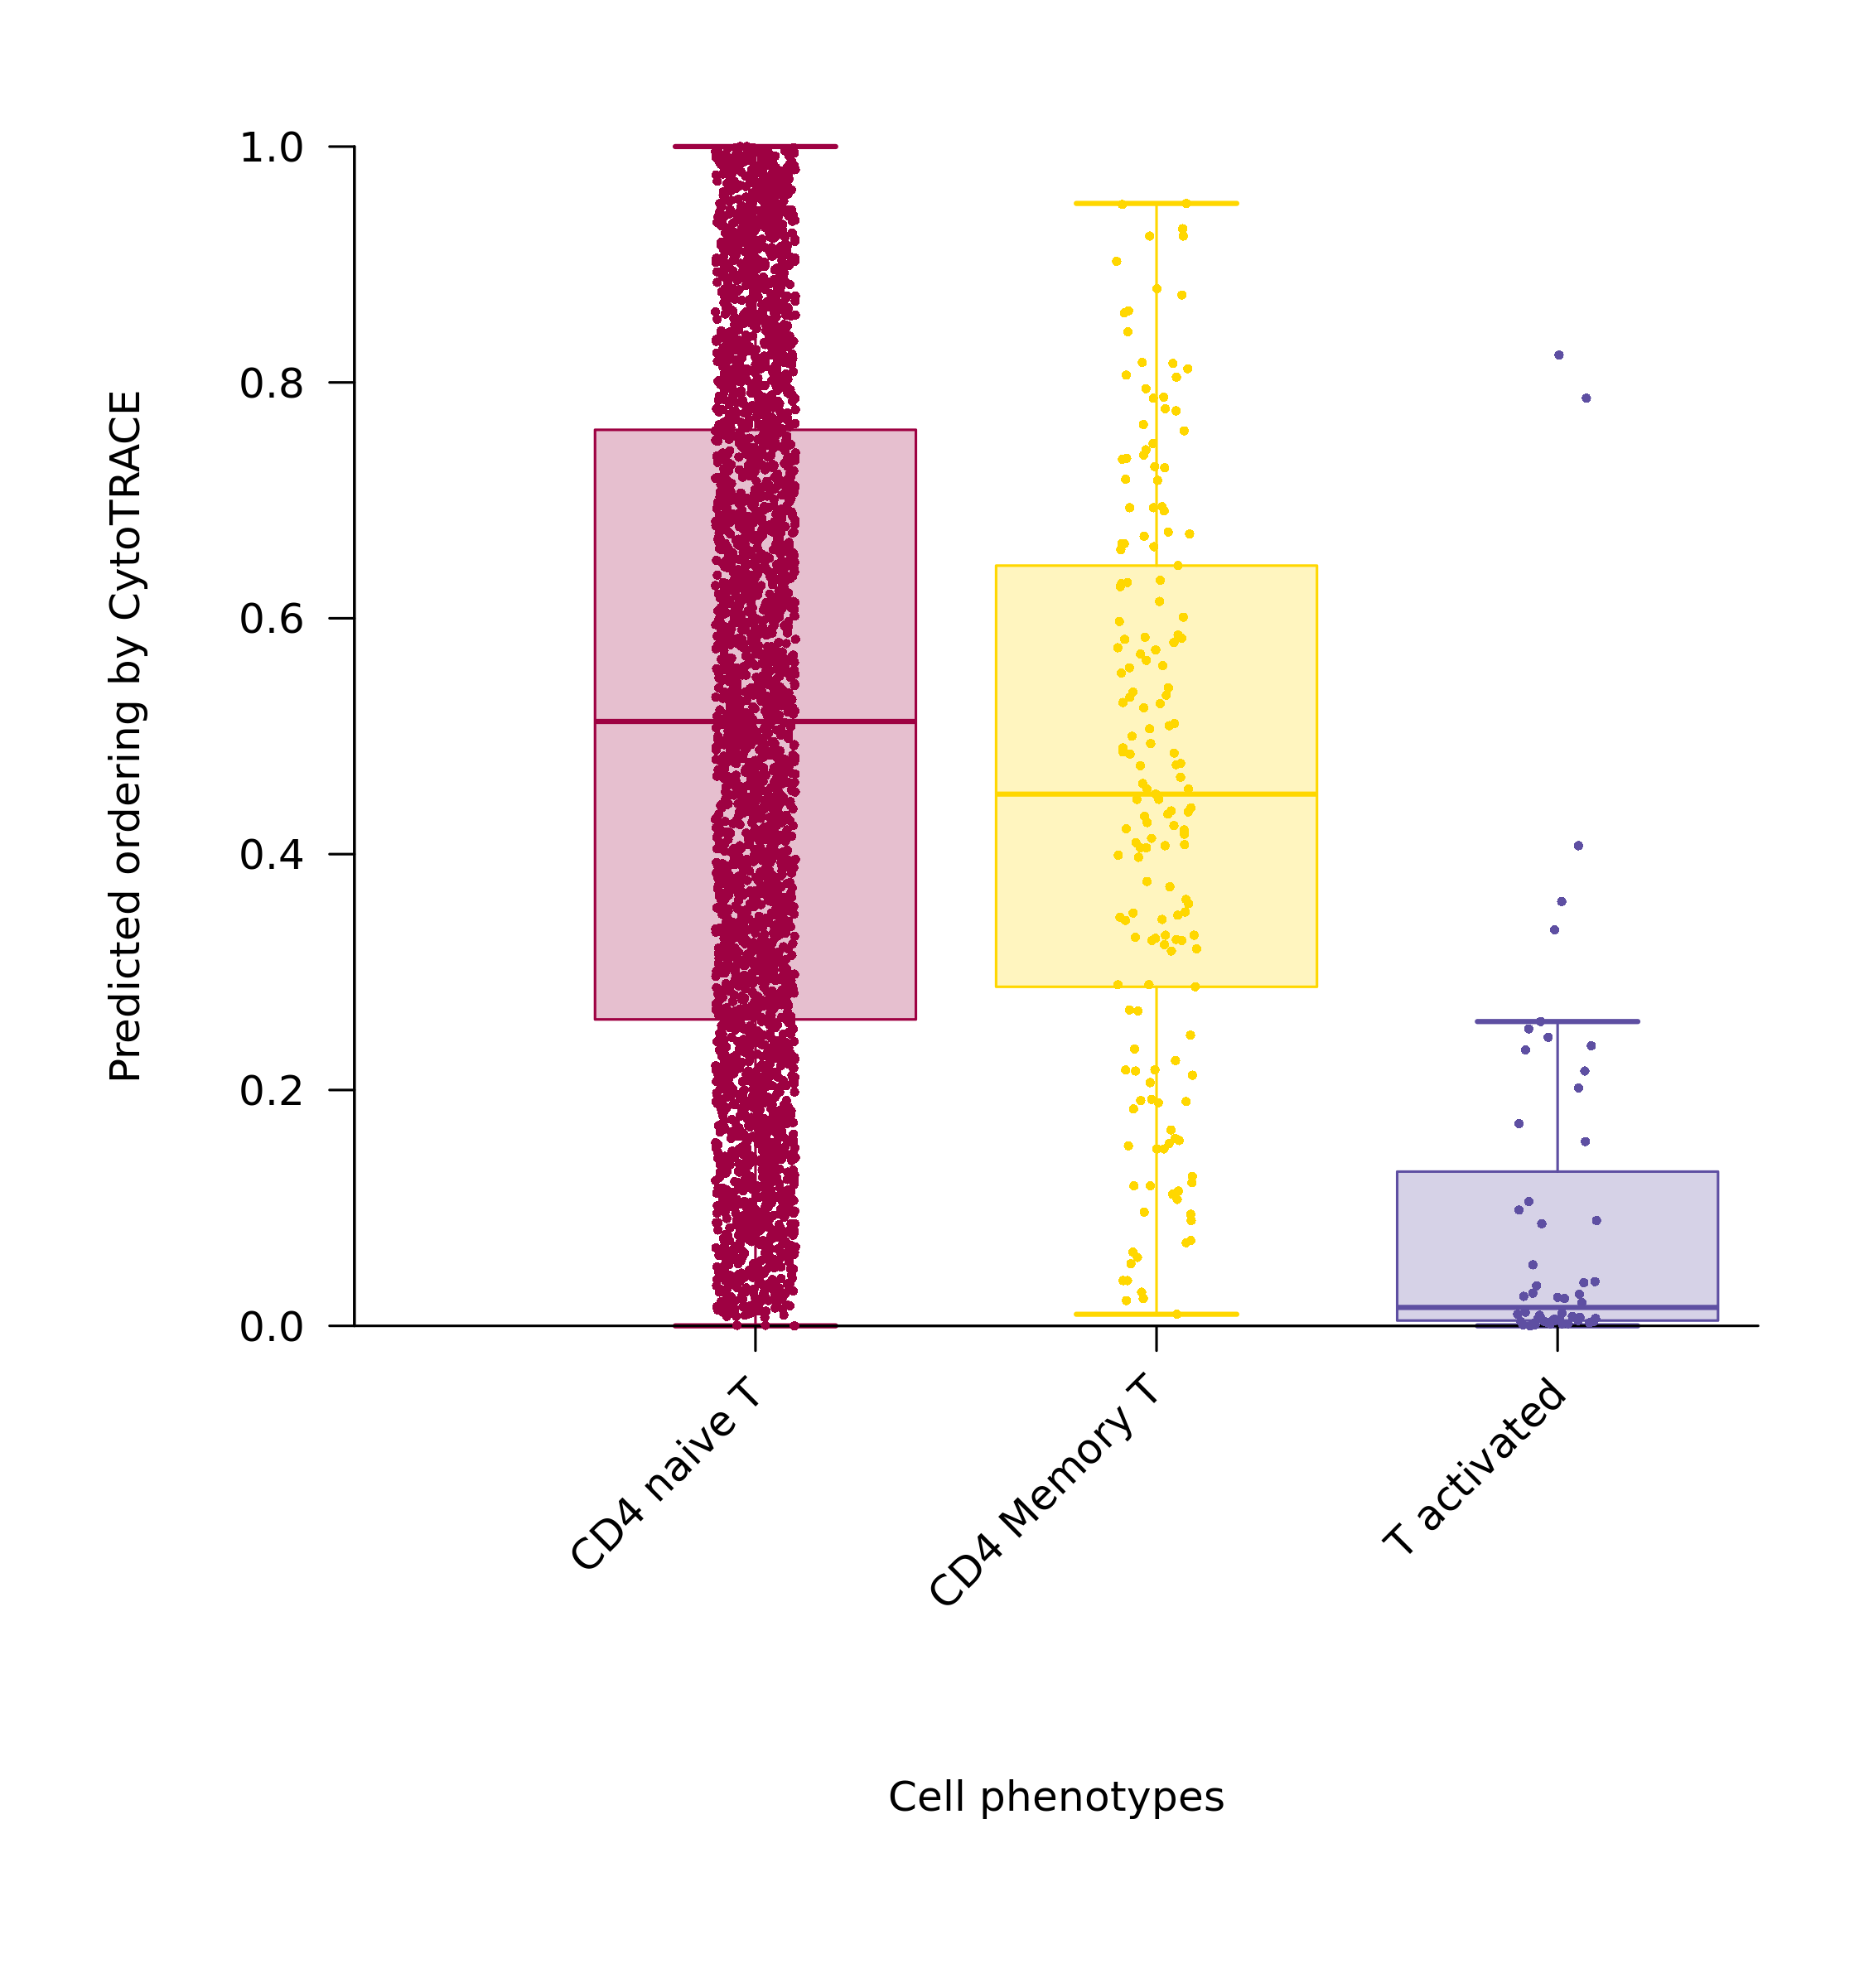
- Graph Interpretation: Shows the distribution of CytoTRACE scores by cell type (or your selected grouping).
- Analysis Points: Quantitatively compare the differentiation potential of different cell populations. For example, the box position for stem cell populations should be significantly higher than that for other differentiated cell populations.
CytoTRACE-Related Genes Bar Plot
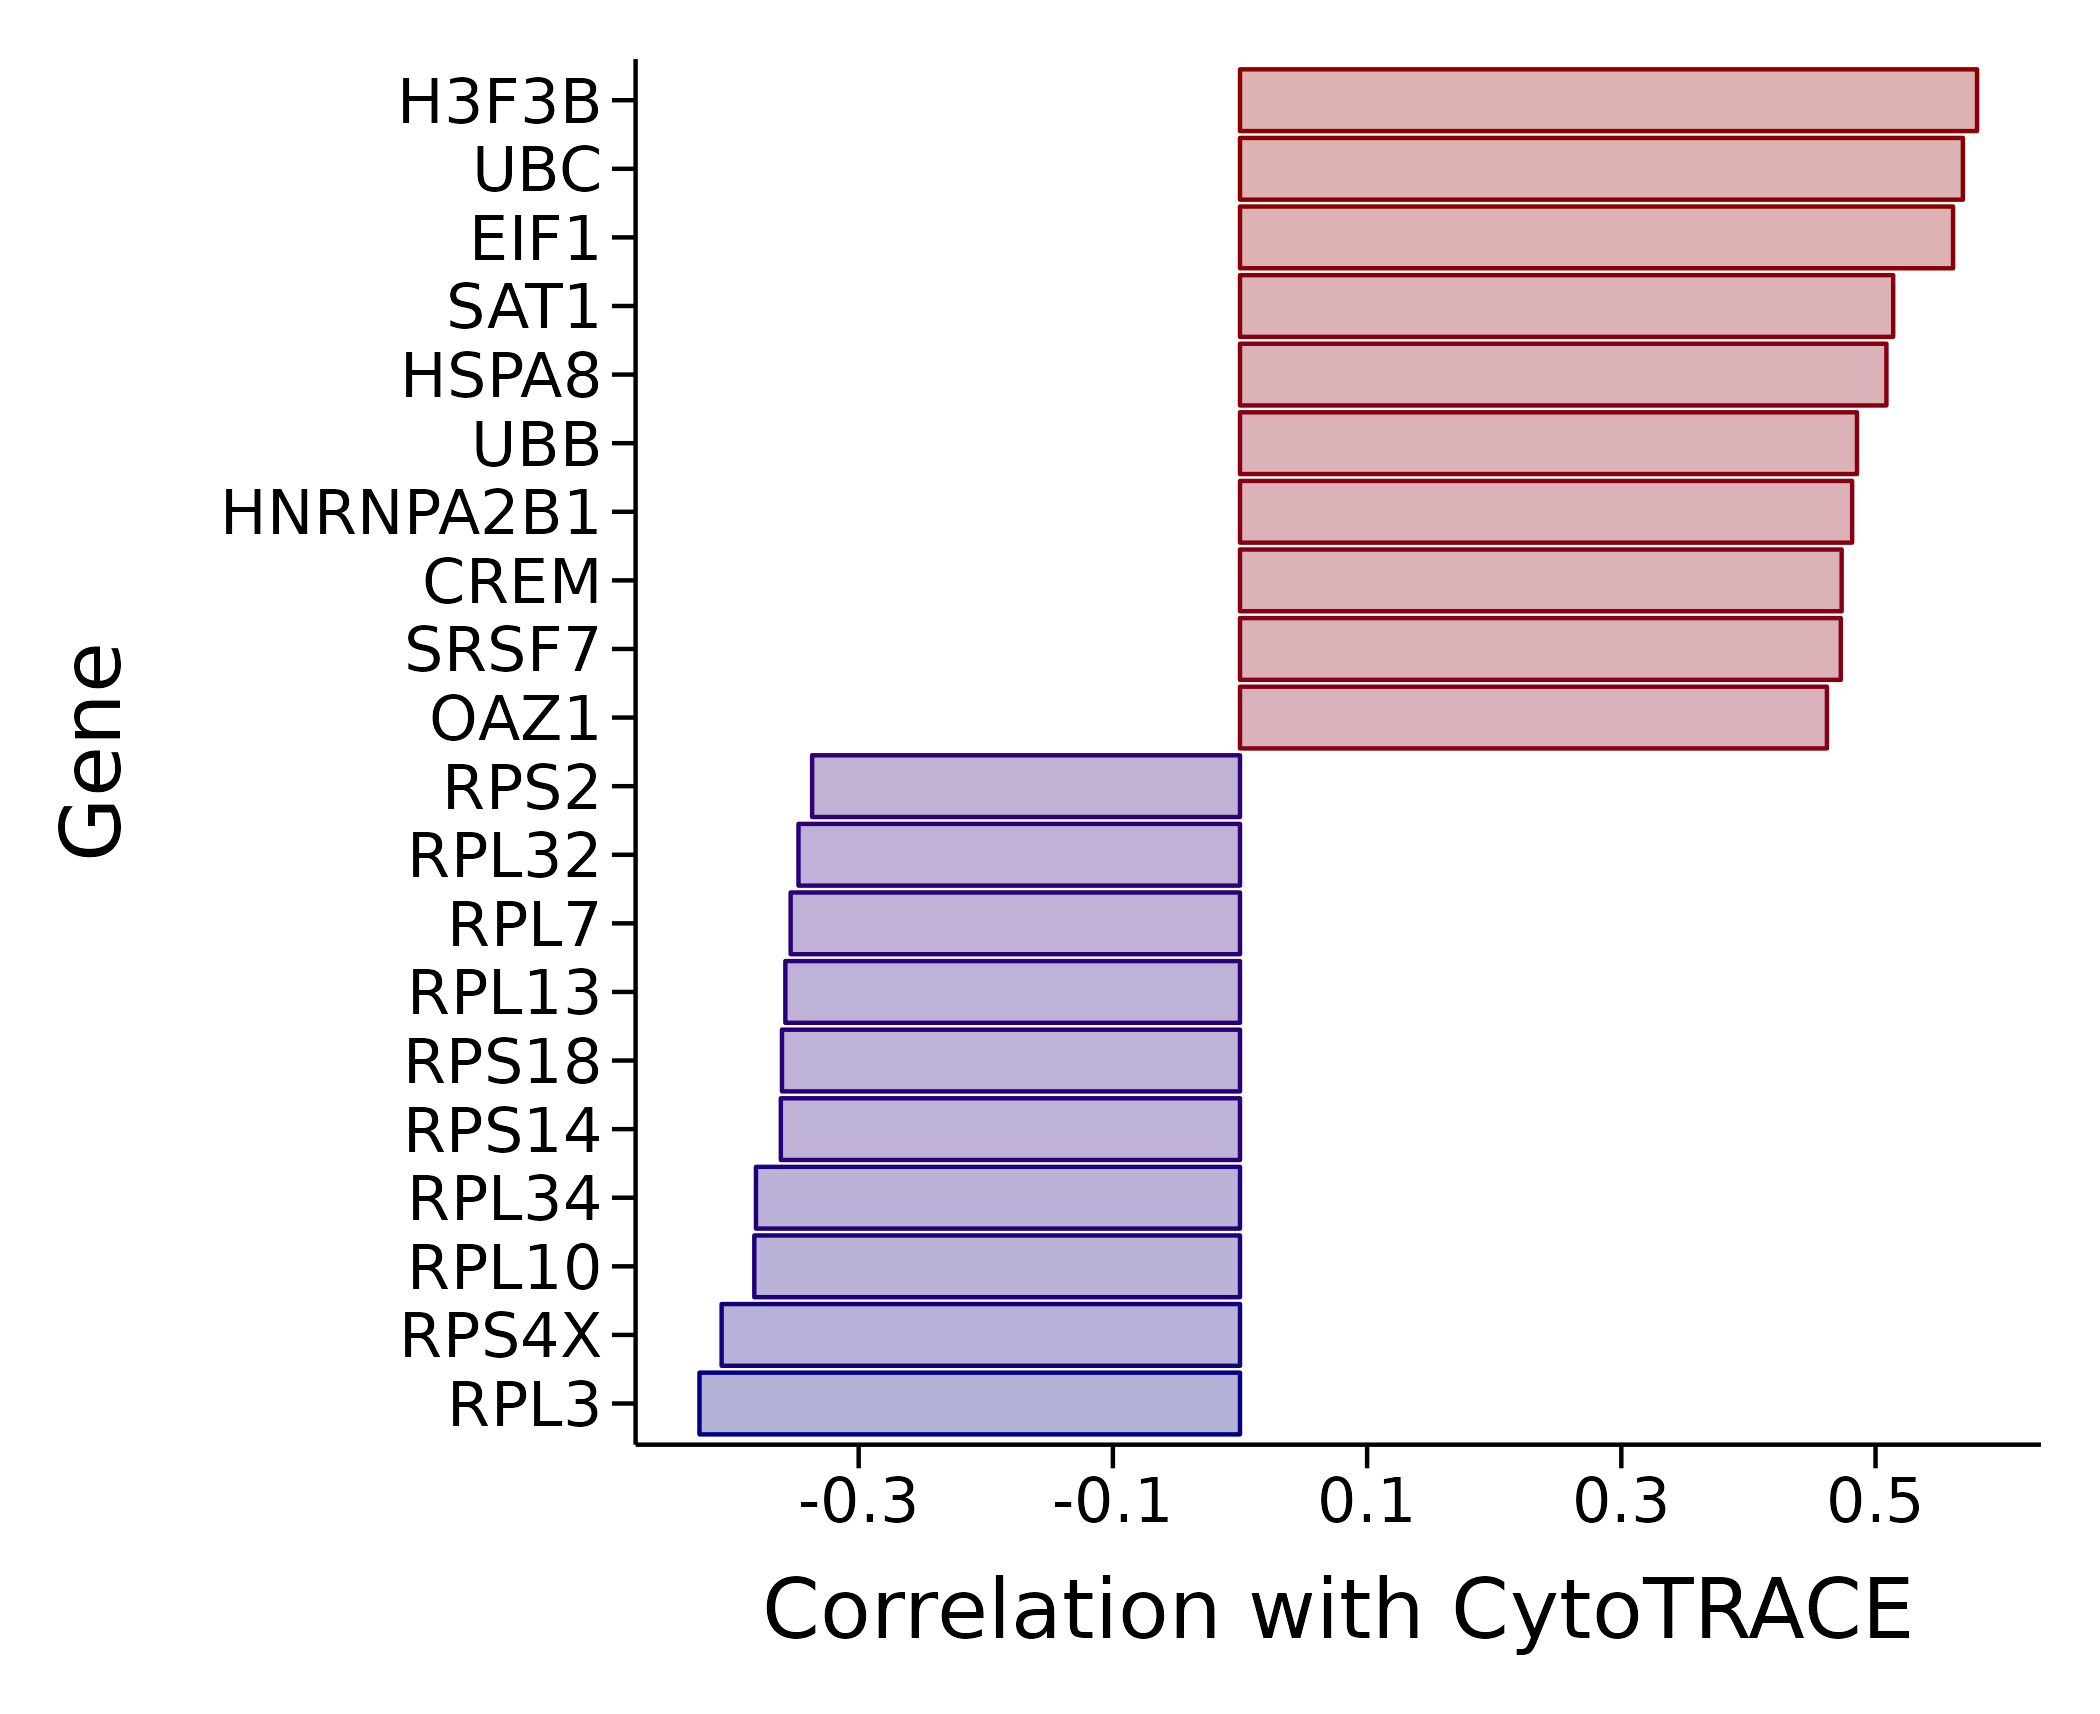
- Graph Interpretation: This plot shows genes most strongly correlated with CytoTRACE scores through a bar plot. The x-axis represents correlation coefficients, and the y-axis is gene names.
- Analysis Points:
- Positively correlated genes (red/warm colors): Bars point to the right, indicating that these genes' expression levels are positively correlated with high differentiation potential. They are typically genes related to stemness maintenance, progenitor cell characteristics, or the cell cycle.
- Negatively correlated genes (blue/cool colors): Bars point to the left, indicating that these genes' expression levels are positively correlated with low differentiation potential (i.e., high differentiation degree). They are typically functional genes or marker genes for terminal cell differentiation.
- By analyzing these genes, you can gain insights into the core molecular networks that regulate cell differentiation states.
Result File List
Core Data File: CytoTRACE_result.csv
This is the most critical output file of the analysis, containing detailed scoring information for each cell:
| Column Name | Detailed Description |
|---|---|
| CytoTRACE | Predicted cell differentiation potential score, ranging from 1.0 (lowest differentiation degree) to 0.0 (highest differentiation degree). |
| CytoTRACErank | Ranking based on CytoTRACE scores. Higher rankings represent lower cell differentiation degrees. |
| GCS | Gene Counts Signature, the geometric mean expression value of the top 200 genes positively correlated with gene counts. |
| Counts | Total number of expressed genes detected in each cell (Gene Counts). |
Main Charts and Files
| File Name | Content Description |
|---|---|
CytoTRACE_result.csv | The core data file mentioned above. |
CytoTRACE_plot_table.txt | Plotting data for generating the score box plot. |
CytoTRACE_plot.png/pdf | Mapping plot of CytoTRACE scores on dimensionality reduction plots. |
CytoTRACE_by_Phenotype_Boxplot.png/pdf | Score box plot displayed by cell type. |
CytoGenes.png/pdf | Bar plot of top genes positively and negatively correlated with CytoTRACE scores. |
Application Cases
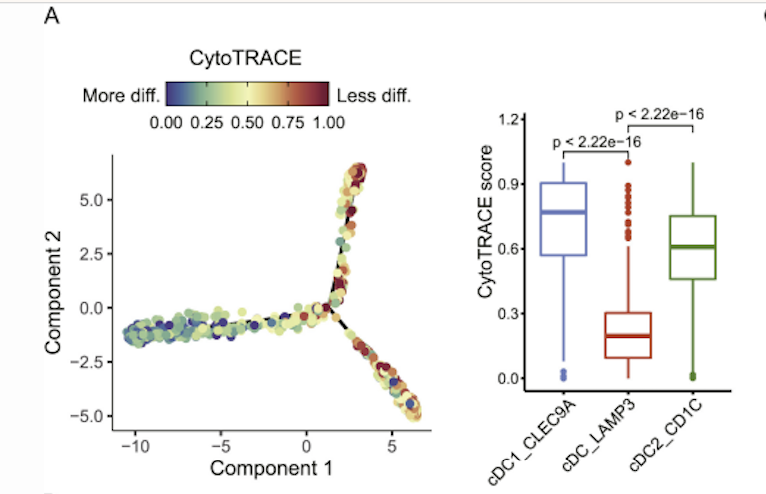
Literature Source: A pan-cancer single-cell transcriptional atlas of tumor infiltrating myeloid cells. Cell. 2021
Research Background: This study aimed to explore the developmental origin of a mature LAMP3+ DC subset among tumor-infiltrating dendritic cells (DCs).
Analysis Method: Researchers used CytoTRACE to evaluate the differentiation states of different DC subsets. Results showed that classical cDC1 and cDC2 subsets had higher CytoTRACE scores compared to the mature LAMP3+ DC subset, indicating they were in earlier differentiation stages. This result provided strong evidence for the hypothesis that LAMP3+ cDCs may differentiate from cDC1 and cDC2.
Precautions
1. CytoTRACE is not a trajectory construction tool: It does not generate connection paths or branches for cells on its own, but provides a measure of "differentiation potential" for each cell. Its best use is in combination with other tools (such as Monocle2/3), providing them with objective starting point information.
2. Beware of technical bias: The core of CytoTRACE is gene counting, so results are sensitive to sequencing depth and batch effects. If different cell types are sequenced in different batches or have significant differences in sequencing depth, technical bias may be introduced. These factors should be considered when interpreting results.
3. First cluster, then analyze: If your dataset contains biologically completely unrelated cell lineages (such as immune cells and epithelial cells), it is recommended to separate them first, then run CytoTRACE separately on the lineage you are interested in (such as the T cell differentiation lineage), and the results will be more meaningful.
Frequently Asked Questions (FAQ)
Q1: Why should I use CytoTRACE?
A: CytoTRACE can predict cell differentiation states without any prior knowledge, especially suitable for the following scenarios:
- Predicting differentiation states in human tissues where developmental hierarchies are not yet clear.
- Studying cell differentiation heterogeneity in pathological tissues such as cancer.
- Providing objective, unbiased starting point suggestions for trajectory construction tools like Monocle.
- Identifying key genes related to stem cell characteristics and differentiation processes.
Q2: In what cases might CytoTRACE be unsuitable or require extra attention?
A: In the following situations, additional preprocessing is recommended or special attention should be paid when interpreting results:
- Datasets containing multiple heterogeneous tissues: CytoTRACE will rank all cells in the dataset. If data comes from completely different tissue systems (such as a mixture of hematopoietic cells and endothelial cells), it is recommended to split them first and then run CytoTRACE separately.
- Data containing both quiescent and proliferating stem cell populations: CytoTRACE itself may have difficulty distinguishing between these two states. They can be distinguished by combining indicators such as total RNA content; typically, quiescent stem cells have lower RNA content.
- Strong batch effects: If different cell types are sequenced in different batches, technical differences may lead to gene counting bias, thus affecting results. Such batch effects should be avoided as much as possible during experimental design.
References
- Gulati, G. S., et al. (2020). Single-cell transcriptional diversity is a hallmark of developmental potential. Science, 367(6476), 405–411.
- Cheng S, et al. (2021). A pan-cancer single-cell transcriptional atlas of tumor infiltrating myeloid cells. Cell, 184(3):792-809.e23.